
코스피가 5,000선 아래로 내려간 지 하루 만에 다시 올라섰다. 2026년 11월 17일에는 4,968.48로 마감했고, 18일에는 1.99% 오른 5,067.44로 거래를 마쳤다. 숫자만 보면 한숨을 돌린 셈이다. 그러나 하루의 상승이 곧 시장의 불안이 끝났다는 뜻은 아니다. 반등의 크기와 기업 실적, 특정 업종에 쏠린 구조를 나눠 볼 필요가 있다.
장중 5100과 종가 5067은 다른 이야기
네이버페이 증권의 일별 지수 자료를 대조하면 코스피는 16일 5,100.50에서 17일 4,968.48로 132.02포인트 하락했다. 하락률은 2.59%다. 18일에는 98.96포인트를 되돌렸다. 17일 하락 폭의 약 75%를 회복했지만, 16일 종가보다는 여전히 33.06포인트 낮았다.
18일 장중 고점은 5,133.14였다. 하지만 장을 마칠 때는 5,100선을 지키지 못했다. 따라서 이날 흐름은 ‘장중 5,100선 회복’과 ‘종가 기준 5,000선 회복’으로 구분하는 것이 정확하다. 코스닥도 17일 650.06에서 18일 662.81로 1.96% 올랐다.
같은 날짜의 숫자라도 장중 집계인지 최종 마감인지에 따라 의미가 달라진다. 주식을 누가 더 많이 샀는지 보여주는 투자자별 매매 자료도 마찬가지다. 오전의 순매수를 하루 전체의 매수세로 단정해서는 안 된다.
| 날짜 | 코스피 종가 | 코스닥 종가 | 기준 |
|---|---|---|---|
| 2026.11.16 | 5,100.50 | 665.65 | 마감 · 포인트 |
| 2026.11.17 | 4,968.48 | 650.06 | 마감 · 포인트 |
| 2026.11.18 | 5,067.44 | 662.81 | 마감 · 포인트 |
자료: 네이버페이 증권 KOSPI 일별 시세 (2026.11.16~18) · 네이버페이 증권 KOSDAQ 일별 시세 (2026.11.16~18) · 하나증권 / Hana Securities · Morning Brief · 2026.11.18
엔비디아 실적은 확인됐다…미래까지 확정된 것은 아니다
엔비디아는 미국 현지시간 11월 17일, 2027회계연도 3분기 매출이 1,158억 달러라고 발표했다. 전년 같은 분기보다 103% 늘었다. 이 가운데 데이터센터 매출은 1,076억 달러였다. 전체 매출과 특정 사업부 매출을 섞어 읽지 않아야 한다.
공식 발표는 AI 관련 사업 규모가 커졌음을 보여준다. 다만 이 한 번의 실적만으로 코스피 반등의 원인을 모두 설명하거나 국내 반도체 기업의 미래 이익을 보장할 수는 없다. 이미 발표한 실적은 지나온 결과이고, 앞으로의 주문·비용·이익 전망은 계속 확인해야 할 대상이다.
종목이 많아도 같은 방향으로 흔들릴 수 있다
자본시장연구원이 7월 27일 발표한 보고서에 따르면, 2026년 6월 말 삼성전자와 SK하이닉스의 코스피 시가총액 비중은 합계 55%였다. 시가총액은 주가에 주식 수를 곱한 기업의 시장 가치다. 두 기업이 지수에서 차지하는 무게가 컸다는 의미다. 이는 6월 말 수치이며 11월 현재 비중으로 읽어서는 안 된다.
연구진은 소수 종목의 비중이 커지면 위험을 나누는 효과가 약해지고 해당 업종의 충격이 지수로 전달될 수 있다고 분석했다. 이 보고서는 상반기의 구조를 설명한 연구다. 11월 특정 거래일의 하락 원인을 직접 입증한 자료는 아니다.
자료: 자본시장연구원 / KCMI · 주식시장 변동성 상승의 배경 검토 · 2026.7.27

‘싸 보인다’는 평가에서 빠뜨리기 쉬운 분모
주가수익비율인 PER은 주가를 주당순이익으로 나눈 값이다. 쉽게 말해 기업이 벌어들이는 이익에 비해 주가가 어느 정도인지를 보는 숫자다. ‘선행 PER’은 이미 확정된 이익 대신 앞으로 벌 것으로 예상하는 이익을 쓴다.
예상 이익이 줄어들면 주가가 그대로여도 PER은 올라간다. 그래서 낮은 숫자만으로 매수 적기라고 단정하기 어렵다. 어떤 시점의 이익 전망을 사용했는지, 이후 전망이 바뀌었는지를 함께 봐야 한다. 주가순자산비율인 PBR도 장부상 순자산과 주가를 비교하는 지표이지, 실제 청산 때 돌려받을 금액을 보장하는 숫자는 아니다.
지수보다 먼저 확인할 세 가지 질문
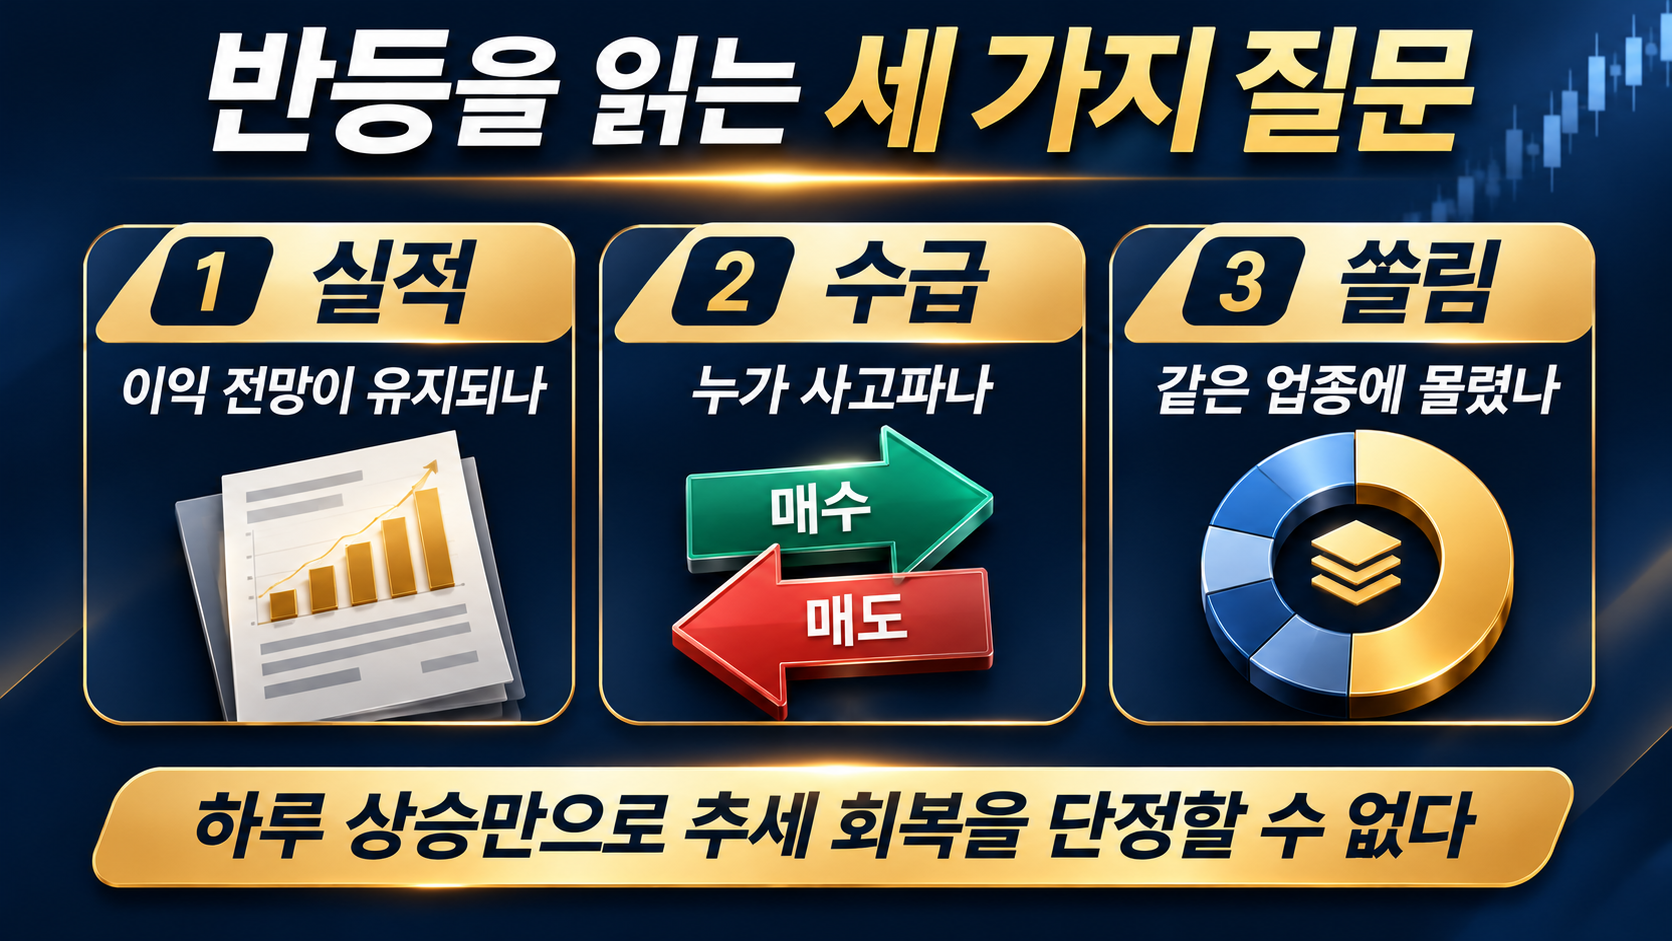
첫째는 실적이다. 기업이 발표한 결과와 시장이 예상하는 미래 이익을 구분해 읽는다. 둘째는 수급이다. 누가 사고파는지 보되, 같은 시장과 같은 집계 시점의 자료를 비교한다. 셋째는 쏠림이다. 여러 종목을 갖고 있어도 같은 산업에 집중돼 있다면 비슷한 충격에 함께 흔들릴 수 있다.
투자 판단을 기록할 때는 매수·매도 가격뿐 아니라 판단의 근거와 그 근거가 달라질 조건을 함께 적어둘 수 있다. 가격이 떨어졌다는 이유만으로 추가 매수를 결정하는 것과, 실적과 위험을 다시 확인하고 판단하는 것은 다른 과정이다.
5,000선 회복은 확인된 시장의 움직임이다. 회복이 이어질지는 아직 확정할 수 없다. 당장의 지수 숫자에 결론을 맡기기보다, 실적·수급·집중도의 변화가 함께 나타나는지 살피는 것이 이번 반등을 읽는 출발점이다.
만인의 탑 편집국 | 자료 확인: 2026년 11월 19일. 시장 비교 기준은 11월 18일 마감이며 19일 장중 시황을 뜻하지 않습니다. 공식 기업 발표·연구 원문·시세 제공 자료를 바탕으로 작성했습니다. 특정 금융상품의 매수·매도를 권유하는 기사가 아닙니다.
KOSPI recovered above 5,000 one day after closing below that level. It finished November 17, 2026 at 4,968.48, then rose 1.99% to 5,067.44 on November 18. That offered some relief. Yet one positive session does not establish that market uncertainty has ended. The size of the rebound, company earnings and industry concentration need to be examined separately.
An intraday 5,100 and a 5,067 close tell different stories
Daily index data provided by Naver Pay Securities show KOSPI falling 132.02 points, or 2.59%, from 5,100.50 on November 16 to 4,968.48 on November 17. It recovered 98.96 points on November 18. That reversed approximately 75% of the previous day’s point loss, but left the index 33.06 points below its November 16 close.
The November 18 intraday high was 5,133.14. The index did not hold 5,100 at the close. The accurate distinction is therefore a recovery above 5,100 during trading and a recovery above 5,000 at the close. KOSDAQ also rose, from 650.06 on November 17 to 662.81 on November 18, a gain of 1.96%.
Even figures for the same date can mean different things depending on whether they describe intraday trading or the final close. The same applies to investor trading flows, which show who bought more than they sold. Morning net buying cannot be treated as evidence of net buying for the entire session.
| Date | KOSPI close | KOSDAQ close | Basis |
|---|---|---|---|
| 2026.11.16 | 5,100.50 | 665.65 | Close · points |
| 2026.11.17 | 4,968.48 | 650.06 | Close · points |
| 2026.11.18 | 5,067.44 | 662.81 | Close · points |
Sources: 네이버페이 증권 KOSPI 일별 시세 (2026.11.16~18) · 네이버페이 증권 KOSDAQ 일별 시세 (2026.11.16~18) · 하나증권 / Hana Securities · Morning Brief · 2026.11.18
NVIDIA’s results are reported facts; future earnings are not
On November 17, U.S. time, NVIDIA announced fiscal 2027 third-quarter revenue of $115.8 billion, up 103% from a year earlier. Data Center revenue accounted for $107.6 billion. Total company revenue should not be confused with revenue from one business segment.
The release documents the expansion of its AI-related business. A single earnings announcement, however, cannot explain every cause of KOSPI’s rebound or guarantee future profits for Korean chipmakers. Reported earnings describe past performance; future orders, costs and earnings expectations still require monitoring.
Many holdings can still move in the same direction
A July 27 report by the Korea Capital Market Institute found that Samsung Electronics and SK hynix together represented 55% of KOSPI market capitalization at the end of June 2026. Market capitalization is share price multiplied by the number of shares. The figure shows the two companies’ weight in the index at that time, not their current November weight.
The researchers explained that concentration can weaken diversification and transmit industry shocks to the index. Their study examined first-half market structure. It does not directly establish the causes of a particular November decline.
Sources: 자본시장연구원 / KCMI · 주식시장 변동성 상승의 배경 검토 · 2026.7.27
The denominator behind a stock that looks cheap
The price-to-earnings ratio, or P/E, divides a share price by earnings per share. It compares the stock’s price with the profit the company generates. A forward P/E uses expected future earnings instead of earnings already reported.
If expected earnings decline, P/E rises even when the share price stays unchanged. A low ratio alone therefore does not establish a buying opportunity. The date of the earnings estimate and subsequent revisions matter. Price-to-book, or P/B, compares price with accounting net assets; it does not guarantee the amount shareholders would receive in an actual liquidation.
Three questions to ask before relying on the headline index
First, earnings: distinguish companies’ reported results from expectations about future profit. Second, flows: examine who is buying and selling, comparing the same market and the same measurement time. Third, concentration: several stocks can still face similar shocks if they belong to the same industry.
An investment record can include not only transaction prices but also the reasons for a decision and the conditions that would change those reasons. Adding to a position simply because its price has fallen is a different process from reassessing earnings and risks before making a decision.
The recovery above 5,000 is an observed market move. Its continuation is not established. Looking for changes in earnings, flows and concentration together provides a starting point for understanding the rebound without treating a single index level as a conclusion.
MANINTOP Newsroom | Sources checked November 19, 2026. Market comparisons use the November 18 close, not November 19 intraday trading. Based on company releases, original research and market-data providers. This article does not recommend buying or selling a particular financial product.
내가 찾는 상품 키워드, 지금 얼마나 검색될까?
네이버 월간 검색량 + 구글 볼륨 + 아이템스카우트 실시간 상품수와 경쟁강도 배지를 0.5초 만에 무료로 확인하세요.